Industry 4.0 Stack on Business Central
How to build a real Industry 4.0 stack on Microsoft Business Central: sensors, edge, MES, ERP and analytics. Practical scope, not slideware.

Industry 4.0 architecture on Microsoft Dynamics 365 Business Central, deployed by Davisa — Microsoft Solutions Partner for Business Central since 2003
Industry 4.0 has been a buzzword for a decade. By 2026, the term has lost most of its marketing weight and become something more useful: a reasonably stable reference architecture that mid-sized manufacturers can actually buy, deploy and operate. The pieces are commoditized, the protocols are settled, and the integration patterns are documented.
This article walks through the five-layer stack we deploy at Davisa for industrial customers, how Microsoft Business Central plus the dv* extensions map onto it, which IoT patterns work in the field, and what KPIs you can realistically expect to move.
What Industry 4.0 means in 2026 (beyond the buzzword)
Strip away the marketing and Industry 4.0 reduces to four operational shifts:
- Machines emit data continuously, not at end-of-shift handover.
- That data is normalized and aggregated before it reaches the ERP, so planners see signal instead of noise.
- Decisions move closer to the event — a downtime is logged when it starts, not reconstructed two days later from a paper sheet.
- The same data feeds finance, maintenance and quality, not just production.
Everything else — digital twins, AI vision, predictive maintenance, autonomous AGVs — is built on top of those four shifts. If your shop floor still runs on whiteboards and end-of-shift Excel, no amount of AI will fix that. The foundation has to come first.
The 5 layers of a real I4.0 stack
The reference architecture we deploy has five layers, each with a clear responsibility and a clear handoff to the next:
Layer 1 — Sensors and PLC. Physical instrumentation: temperature probes, energy meters, vibration sensors, vision cameras, plus the PLCs and SCADA systems already running the machines. This layer speaks Modbus, Profinet, EtherCAT, or vendor-proprietary protocols.
Layer 2 — Edge gateway. Industrial PCs or ruggedized edge devices sitting next to the line. They translate Layer 1 protocols into OPC-UA or MQTT, buffer data during network outages, and run light pre-processing (deduplication, downsampling, anomaly tagging). This is also where local HMI dashboards live for operators.
Layer 3 — MES / shop-floor execution. Order dispatch, work-in-progress tracking, operator data entry, downtime registration, scrap reporting, traceability genealogy. In a dvproduction deployment this layer is inside Business Central, not a separate database.
Layer 4 — ERP. Planning, costing, procurement, finance, sales, customer service. Business Central sits here, consuming aggregated production events from Layer 3 and pushing back orders, schedules and BOM updates.
Layer 5 — Analytics and AI. Time-series storage (Azure Data Explorer, Microsoft Fabric), dashboards (Power BI), predictive models, energy and sustainability reporting. This layer reads from all the others — never the other way around.
The most common architectural mistake is collapsing layers 2 and 3, or skipping the edge entirely and trying to push raw PLC data straight to the ERP. Both lead to performance problems within 12 months of go-live.
Mapping the stack to Microsoft + Davisa extensions
| Layer | Microsoft component | Davisa extension |
|---|---|---|
| 1. Sensors/PLC | — | — |
| 2. Edge gateway | Azure IoT Edge | dvproduction IoT module |
| 3. MES | Business Central | dvproduction, dvquality, dvgmao |
| 4. ERP | Business Central | dvproduction (costing, planning) |
| 5. Analytics | Power BI, Microsoft Fabric | dvproduction OEE dashboards |
The advantage of this mapping is that layers 3 and 4 share the same database. A downtime registered by an operator on a shop-floor terminal immediately affects available capacity in the planning board, automatically creates a corrective work order in dvgmao, and updates the cost of the affected production order. No interface, no batch sync, no reconciliation. That is the reason we recommend keeping MES inside Business Central for SMB manufacturers — every kilometer of interface code you avoid is a kilometer you do not have to maintain.
For deeper scope on the MES side, see our article on Manufacturing Operations Management on Business Central. For maintenance specifically, the comparison Fracttal, Maximo and Mainsaver versus dvgmao covers when a standalone CMMS is worth it.
IoT integration patterns (OPC-UA, MQTT, Azure IoT Hub)
Three patterns cover 95% of the IoT integration work we do in the field:
Pattern A — OPC-UA on the line, MQTT to the cloud. The edge gateway reads PLCs over OPC-UA, aggregates and tags the data, and publishes selected events to Azure IoT Hub over MQTT. Stream Analytics filters and routes events: high-volume telemetry goes to Azure Data Explorer for long-term storage, business-relevant events go to Business Central through the dvproduction connector. This is the default pattern for new lines or lines with modern PLCs.
Pattern B — Modbus retrofit. Older lines without OPC-UA support are retrofitted with low-cost edge gateways that read Modbus TCP and translate to OPC-UA at the gateway. The rest of the stack stays identical. We use this pattern for plants where 30–60% of equipment is more than 15 years old — replacing the PLCs is rarely justified, but adding €600–€2,000 of edge hardware per machine usually is.
Pattern C — Operator-driven capture. Some events cannot be sensed automatically: downtime reasons, quality defects, micro-stop causes. These are captured by operators on touchscreen terminals running the dvproduction shop-floor app. The terminals talk directly to Business Central — no IoT Hub round trip — because the data volume is low and the latency requirements are immediate.
A production-grade plant typically uses all three patterns. Pure-IoT purists who insist on automating every capture point end up with brittle vision systems trying to read damaged labels; pure manual capture loses the high-frequency signal that makes OEE useful. The mix is the answer.
Real KPIs that move (OEE, MTBF, energy/unit, defect rate)
Four KPIs justify the investment in most projects we have audited:
- OEE (Overall Equipment Effectiveness). Baseline measurements often start at 45–58% for SMB plants that have never instrumented properly. Realistic post-stabilization range: 62–76%. The first 4–6 points come from making downtime visible; the next come from scheduling and maintenance changes.
- MTBF (Mean Time Between Failures). Improves once dvgmao captures real failure events instead of relying on operator memory. Typical improvement: 25–45% over 12 months as preventive intervals get tuned to actual failure patterns instead of OEM defaults.
- Energy per unit produced. Energy meters at the line level, normalized against production output, surface the worst offenders. Typical reduction: 6–14% in the first year, mostly from idle-state optimization and shift-changeover discipline.
- First-pass defect rate. When dvquality captures inspections in-line instead of at end-of-line, defects are caught one or two operations earlier. Scrap cost drops 10–25% in the first 9 months.
These are ranges from real customer outcomes, not vendor brochures. The variance inside each range depends almost entirely on how disciplined the operations team is about using the data, not on the software.
Implementation roadmap: 18-24 months realistic
A realistic, end-to-end I4.0 rollout for a single mid-sized plant follows this pacing:
Months 1–3 — Foundation. Business Central core go-live (finance, procurement, sales). dvproduction baseline configuration. Master data cleanup (BOMs, routings, work centers). No IoT yet.
Months 4–7 — Shop-floor capture. Touchscreen terminals deployed. Operators trained on downtime registration and production confirmation. OEE measurement starts. dvquality inspection plans live.
Months 8–12 — IoT layer. Edge gateways installed on priority lines. OPC-UA / MQTT integration. Stream Analytics filtering rules. First real OEE numbers stabilize. dvgmao tied to downtime events.
Months 13–18 — Analytics and optimization. Power BI dashboards for line managers and plant leadership. Energy meters. First predictive maintenance models on critical assets. Cost accounting tied to real production data instead of standard rates.
Months 19–24 — Scale. Second plant rollout from the stabilized template, or deeper analytics (digital twin, AI vision, sustainability reporting).
Anyone selling a 6-month full Industry 4.0 rollout for a real industrial plant has never lived through a stabilization phase. Plan for 18–24 months. For broader BC pricing context, see Business Central pricing and license levels in 2026.
The technology has matured enough that Industry 4.0 is no longer a research project — it is an operations program. The hard parts are organizational discipline, master-data hygiene and patience to let the stack stabilize before judging the numbers.
Artículos relacionados
AP Invoice Capture in BC: Native Extension vs Portal
AP invoice capture in Business Central: why a native AL extension is more robust than external portals that break reconciliation and APIs.
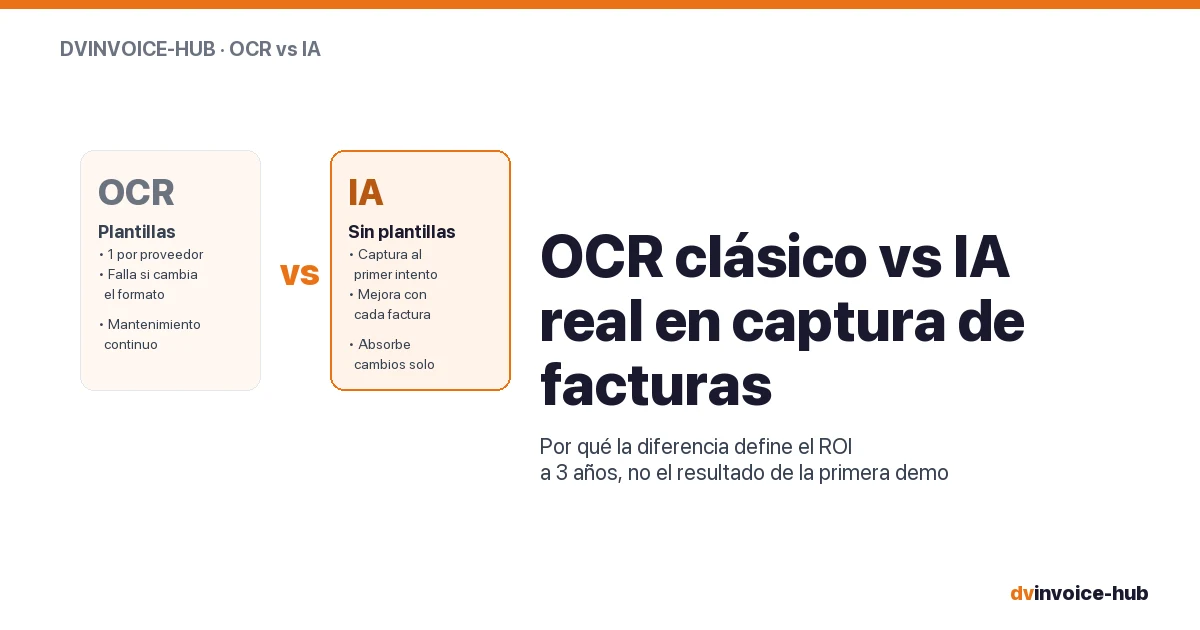
OCR vs AI for AP Invoice Capture in Business Central
Classic OCR and AI-powered capture sound alike but do very different things. Why AI applied to your supplier base reshapes the 3-year ROI.
Best CMMS for European SMB Manufacturers
How to choose a CMMS for a 50-500 employee European plant. Buying mistakes, top alternatives compared, and when native-in-ERP beats a dedicated tool.